
Riset produk dengan kata kunci: panduan Produk Search langkah demi langkahProduct research with keywords: a step-by-step Produk Search guide
Ketik kata kunci seperti yang diketik pembeli, atur filter, lalu lihat estimasi omzet, stok, dan harga puluhan produk dalam satu tabel.
Type a keyword the way buyers do, set filters, then see estimated revenue, stock and price for dozens of products in one table.
Di halaman ini
Riset kata kunci adalah cara tercepat untuk melihat seperti apa pasar sebuah produk: siapa yang menjual, seberapa laku, dan di rentang harga berapa. Panduan ini memakai menu Produk Search.
Screenshot di panduan ini memakai data contoh agar mudah dibaca. Angka dan nama toko di akun Anda akan berbeda.
Pastikan indikator Ekstensi: Online sudah menyala. Belum? Ikuti panduan memulai.
1. Tulis kata kunci
Buka Product Analysis → Produk Search. Ketik kata kunci seperti yang diketik pembeli, misalnya "panci kukus". Di sebelahnya ada pilihan jumlah produk yang diambil (bawaannya 100 produk teratas).
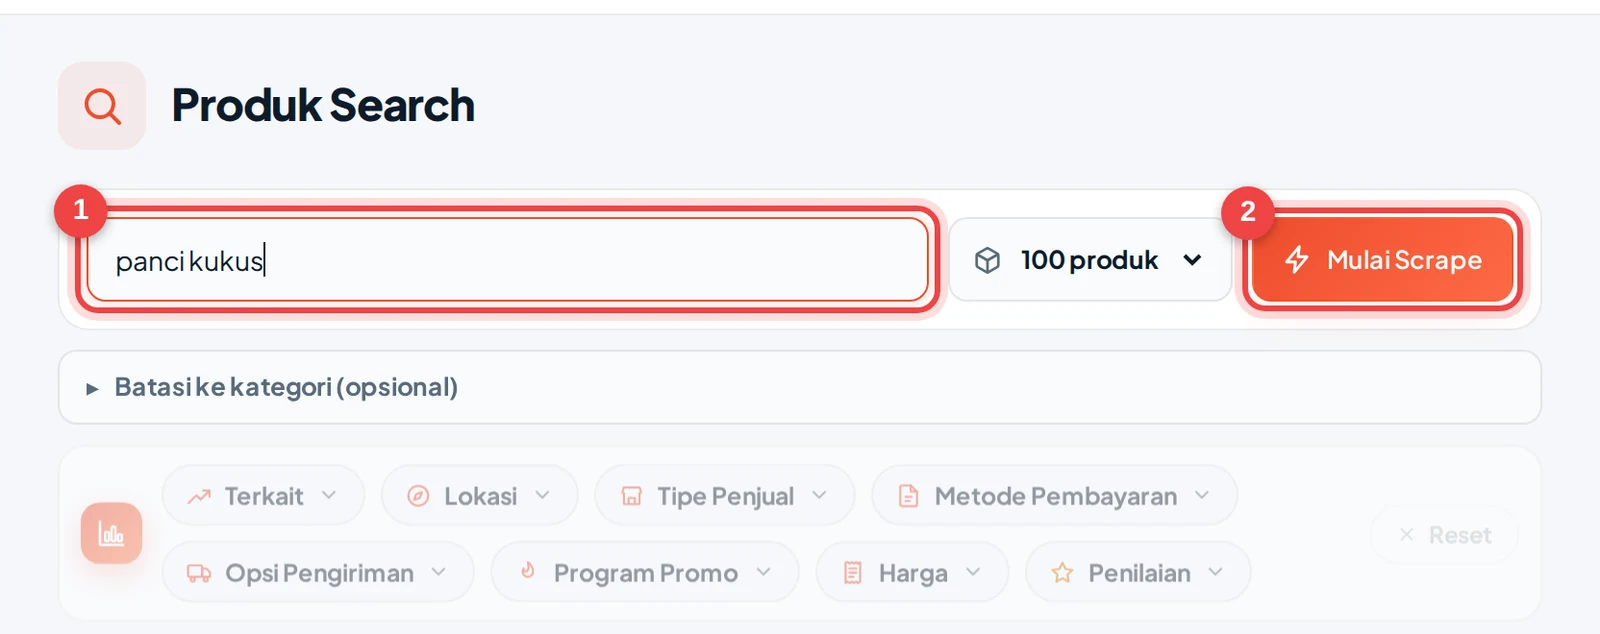
Mulai dengan kata kunci umum, lalu spesifikkan (misalnya "panci kukus stainless"). Bandingkan hasilnya.
2. Atur filter (opsional)
Anda bisa mempersempit hasil sebelum mulai, dan filter bisa digabung:

- Tipe Penjual: menyaring menurut jenis toko
- Harga dan Penilaian: membuang produk di luar rentang yang Anda incar
- Lokasi dan Opsi Pengiriman: menyesuaikan dengan pasar sasaran
- Batasi ke kategori: menyempitkan pencarian ke satu kategori
3. Klik Mulai Scrape
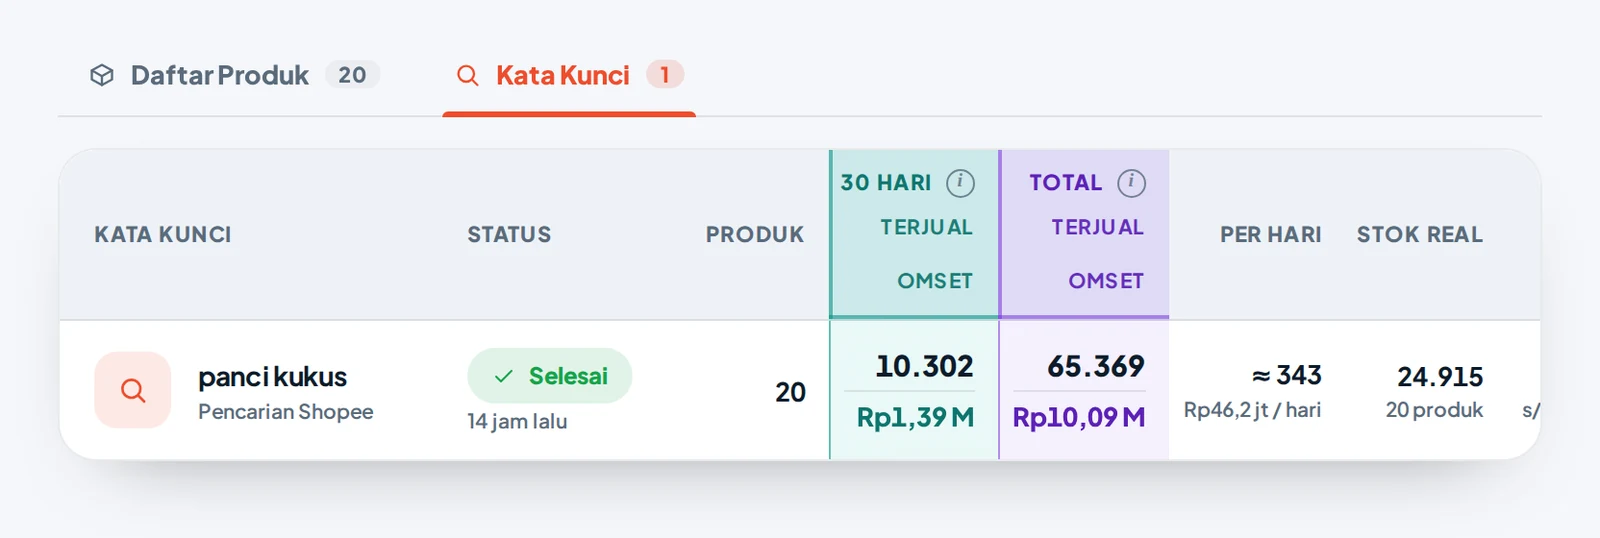
Pencarian masuk antrean dan dikerjakan oleh ekstensi di browser Anda. Prosesnya terlihat di tab Kata Kunci, lengkap dengan status dan jumlah produk yang sudah terkumpul.
4. Baca ringkasannya dulu
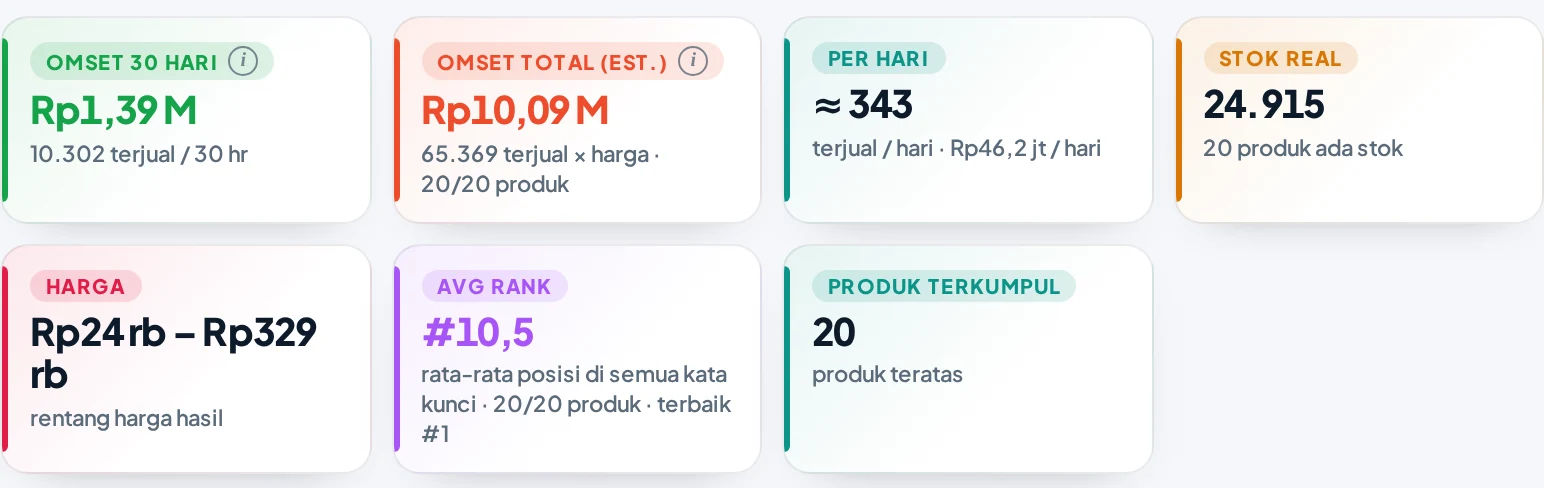
Setelah selesai, tab Daftar Produk menampilkan kartu ringkasan untuk seluruh hasil:
| Kartu | Cara membacanya |
|---|---|
| Omset 30 hari | Perkiraan uang yang berputar dalam 30 hari terakhir |
| Omset total (est.) | Akumulasi sepanjang waktu, bisa menyesatkan untuk produk lama |
| Per hari | Rata-rata terjual per hari |
| Stok real | Jumlah stok dari seluruh produk hasil |
| Harga | Rentang harga yang ada di hasil |
| Avg Rank | Rata-rata posisi produk di hasil pencarian |
Bandingkan Omset 30 hari dengan Omset total. Jika porsi 30 hari besar, pasarnya sedang aktif.
Langkah berikutnya
Pelajari cara membaca setiap kolom di Membaca tabel hasil, dan cara menyimpan hasilnya di Ekspor data ke CSV.
Semua angka omzet adalah estimasi. Gunakan untuk membandingkan, bukan sebagai angka pasti.
Keyword research is the fastest way to see what a product's market looks like: who sells it, how well it sells, and at what price range. This guide uses the Produk Search menu.
Screenshots in this guide use sample data for readability. The numbers and shop names in your account will differ.
Make sure the Extension: Online indicator is on. Not yet? Follow the getting started guide.
1. Enter a keyword
Open Product Analysis → Produk Search. Type a keyword the way a buyer would, for example "steamer pot". Beside it is a choice for the number of products to collect (default is the top 100).
Start with a general keyword, then make it specific (for example "stainless steamer pot"). Compare the results.
2. Set filters (optional)
You can narrow results before starting, and filters can be combined:
- Seller type: filters by shop type
- Price and Rating: drop products outside the range you target
- Location and Shipping option: match your target market
- Limit to category: narrow the search to one category
3. Click Mulai Scrape
The search joins the queue and is carried out by the extension in your browser. Progress shows in the Kata Kunci (Keywords) tab, with status and the number of products collected.
4. Read the summary first
When it finishes, the Daftar Produk (Product List) tab shows summary cards for all results:
| Card | How to read it |
|---|---|
| Omset 30 hari (30-day revenue) | Estimated money moving in the last 30 days |
| Omset total (est.) | All-time accumulation, can mislead for old products |
| Per hari (per day) | Average units sold per day |
| Stok real | Stock across all result products |
| Harga (price) | The price range in the results |
| Avg Rank | Average position of products in search results |
Compare 30-day revenue with total revenue. If the 30-day share is large, the market is active.
Next
Learn how to read each column in Reading the results table, and how to save results in Export data to CSV.
All revenue figures are estimates. Use them to compare, not as exact numbers.